
Prediction
Week Three Graded: The Model Went 10-1, and the Miss Was the Pick Against the Favorite
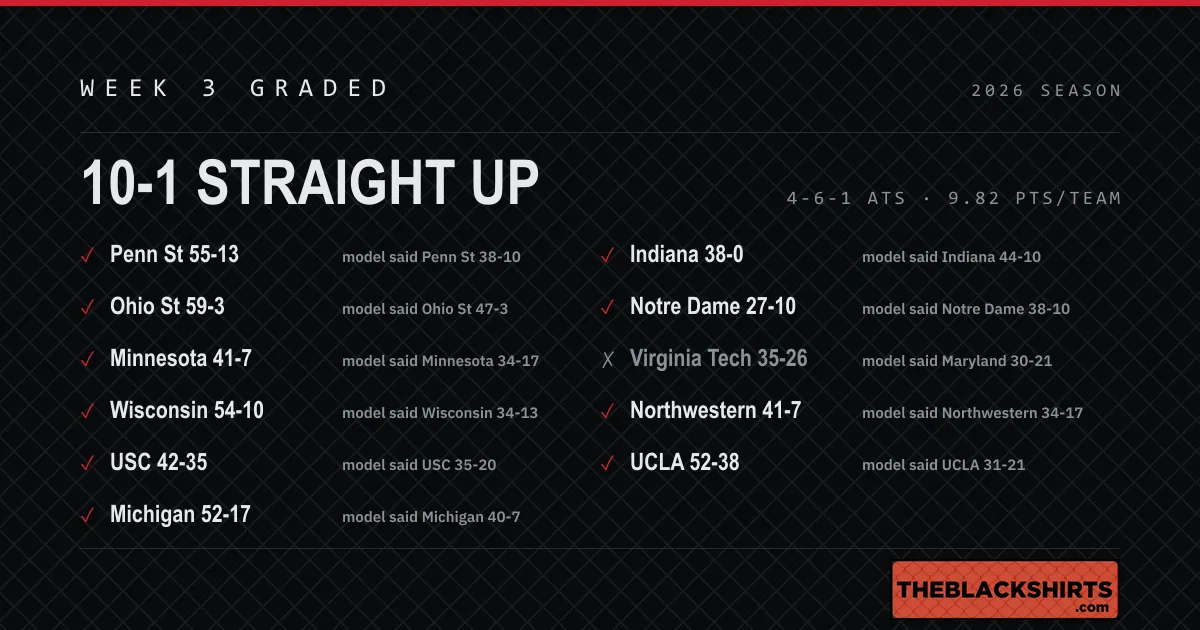
Husker fans, here’s how the model’s Week Three Big Ten board graded out.
10-1 straight up. 4-6-1 against the spread. Week Two was 8-7.
The scorecard
| Game | Model said | Actually | |
|---|---|---|---|
| Buffalo at Penn State | Penn State 38-10 | Penn State 55-13 | ✓ |
| Kent State at Ohio State | Ohio State 47-3 | Ohio State 59-3 | ✓ |
| Akron at Minnesota | Minnesota 34-17 | Minnesota 41-7 | ✓ |
| Eastern Michigan at Wisconsin | Wisconsin 34-13 | Wisconsin 54-10 | ✓ |
| USC at Rutgers | USC 35-20 | USC 42-35 | ✓ |
| UTEP at Michigan | Michigan 40-7 | Michigan 52-17 | ✓ |
| Western Kentucky at Indiana | Indiana 44-10 | Indiana 38-0 | ✓ |
| Michigan State at Notre Dame | Notre Dame 38-10 | Notre Dame 27-10 | ✓ |
| Virginia Tech at Maryland | Maryland 30-21 | Virginia Tech 35-26 | ✗ |
| Colorado at Northwestern | Northwestern 34-17 | Northwestern 41-7 | ✓ |
| Purdue at UCLA | UCLA 31-21 | UCLA 52-38 | ✓ |
Average score error: 9.82 points a team. Season to date: 34-12 straight up, 21-23-2 against the spread, 9.16 points a team.
Against the favorite
The betting favorite won all 11 of these games.
The model picked against the favorite once… Maryland over Virginia Tech. It lost. On the season, the model has gone against the favorite five times, and all five have lost.
On the final margin, the line was closer in seven games and the model in four. Average margin error: 12.0 points for the model, 9.8 for the line. In Week Two it was 14.0 and 12.3.
The miss
Virginia Tech at Maryland was the only game on the board where the model and the line disagreed on the winner. The model had Maryland 30-21 at 69%, labeled a lean. The line had Virginia Tech by 3. Virginia Tech won 35-26.
Winners won by more
In eight of the ten correct picks, the winner won by more than the model projected.
- Wisconsin 54, Eastern Michigan 10. The model had Wisconsin by 21, the line by 23.5. The final margin was 44.
- Minnesota 41, Akron 7. The model had Minnesota by 16, the line by 23.5. The final margin was 34.
- Penn State 55, Buffalo 13. The model had Penn State by 28, the line by 41.5. The final margin was 42.
Where the model was closer than the line
- Northwestern 41, Colorado 7: the model had Northwestern by 17, the line by 3.5. The final margin was 34.
- USC 42, Rutgers 35: the model had USC by 15, the line by 23.5. The final margin was seven.
- Indiana 38, Western Kentucky 0: the model had Indiana by 33, the line by 44.5. The final margin was 38.
- Notre Dame 27, Michigan State 10: the model had Notre Dame by 28, the line by 29.5. The final margin was 17.
UCLA 52, Purdue 38 landed exactly on the line, UCLA by 14, for the week’s push.
Confidence labels
Every pick carries a label… strong, solid, lean or toss-up. This week:
| Label | Straight up |
|---|---|
| Strong | 9-0 |
| Solid | 1-0 |
| Lean | 0-1 |
On the season, strong picks are 26-2. The model’s own season check still reports the labels out of order: lean picks are 0-4 while toss-ups are 4-5, a gap the check flags as larger than chance. Both samples are small.
Nebraska
Nebraska’s 34-7 win over North Dakota wasn’t on this board, because the model only picks games between two FBS teams. The recap is here.
Next
Nebraska opens Big Ten play Saturday at Michigan State, 4 p.m. CT.
Husker Nation, the Week Four Big Ten board comes before Saturday.